AnyCharts - Como formatar um valor em reais no gráfico?

boa tarde!
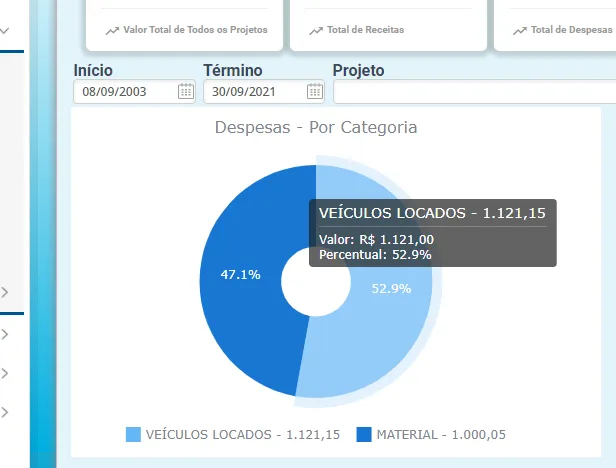
alguém sabe como faço para formatar o valor em em reais? pesquisei bastante e n achei nada na documentação

anychart.onDocumentReady(function () {
      // create pie chart with passed data
      var chart = anychart.pie([
        ['Department Stores', 6371664],
        ['Discount Stores', 7216301],
        ['Men\'s/Women\'s Stores', 1486621],
        ['Juvenile Specialty Stores', 786622],
        ['All other outlets', 900000]
      ]);

      // set chart title text settings
      chart
        .title('Despesas - Por Categoria')
        // set chart radius
        .radius('43%')
        // create empty area in pie chart
        .innerRadius('30%');

      // set container id for the chart
      chart.container('container');
      // initiate chart drawing
      chart.draw();
    });

tentei isso e não funcioonou

    var currentLabels = chart.labels();
    currentLabels.format(function () {
	// format the number
	return anychart.format(this.value.toLocaleString('pt-BR', { style: 'currency', currency: 'BRL' }))
    });

Não pesquisei a fundo pois não conheço o AnyCharts, mas tente algo como:

  var currentLabels = chart.labels();
  currentLabels.format(function () {
      return 'R$ ' + anychart.format.number(this.value, 2, ",", ".", true, true);
  });

Referência: https://docs.anychart.com/Common_Settings/Text_Formatters

Abraço.

1 curtida

isso que vc me passou eu já tinha visto e não funcionou. então contornei…
formatei os valores juntos com a descrição e onde está escrito Quantidade alterei no arquivo
anychart-base.min.js na linha 43702

return "Valor: " + $.YL(this.value.toLocaleString('pt-BR', { style: 'currency', currency: 'BRL' })) + "\nPercentual: " + (100 * this.value / this.getStat("sum")).toFixed(1) + "%"

image