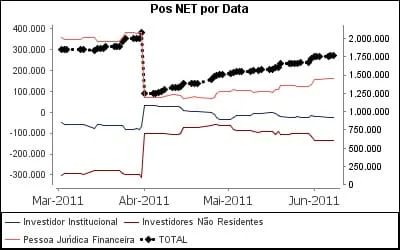
amigos, boa tarde… to gerando um grafico com jfreechart e eixo secundario… quando eu vinculo um dataset ao eixo secundario funciona bem… o problema e quando eu tento formatar a linha desta serie, para ficar pontilhada ele coloca um triangulo como marcador e eu nao sei como tirar esta porcaria… alguem pode me ajudar?? Eu preciso da linha pontilhada, sem os triangulos como marcadores… segue meu cogigo e uma imagem do meu grafico como exemplo
chart = ChartFactory.createTimeSeriesChart(tituloGrafico, tituloEixoX,

                          tituloEixoY,dataset, true, true, false);

           NumberAxis axis2 = new NumberAxis();
           XYPlot plot = (XYPlot) chart.getPlot();

           XYItemRenderer renderer = (XYItemRenderer) plot.getRenderer();

           XYLineAndShapeRenderer renderer2 =  new XYLineAndShapeRenderer();
           renderer2.setSeriesPaint(0, new Color(0,0,0));


           renderer2.setSeriesStroke(0, new BasicStroke(
                3.0f, BasicStroke.CAP_ROUND, BasicStroke.JOIN_MITER,
                1.0f, new float[] {0.0f, 6.0f}, 0.0f));


           plot.setDataset(2, dataset2);
           plot.setRangeAxis(1, axis2);
           plot.setRangeAxisLocation(1, AxisLocation.BOTTOM_OR_RIGHT);
           plot.mapDatasetToRangeAxis(2, 1);
           chart.setBackgroundPaint(Color.WHITE);
           Font fonte = new Font("Courrier", Font.PLAIN, 9);
           chart.getLegend().setItemFont(fonte);
           chart.getPlot().setBackgroundPaint(Color.WHITE);
           chart.getTitle().setFont(new Font("Courrier", Font.BOLD, 12));
           chart.setBorderVisible(true);

           renderer.setSeriesPaint(0, new Color(24,47,100));
           renderer.setSeriesPaint(1, new Color(153,0,0));

           ValueAxis eixoY = plot.getRangeAxis(0);
           ValueAxis eixoY2 = plot.getRangeAxis(1);
           ValueAxis eixoX = plot.getDomainAxis();

           eixoX.setLabelFont(fonte);
           eixoY.setTickLabelFont(fonte);
           eixoY2.setTickLabelFont(fonte);
           plot.setDomainGridlinesVisible(false);
           plot.setRangeGridlinesVisible(false);
           plot.setOutlineVisible(false);
           plot.setRenderer(2, renderer2);