Bom dia galera,
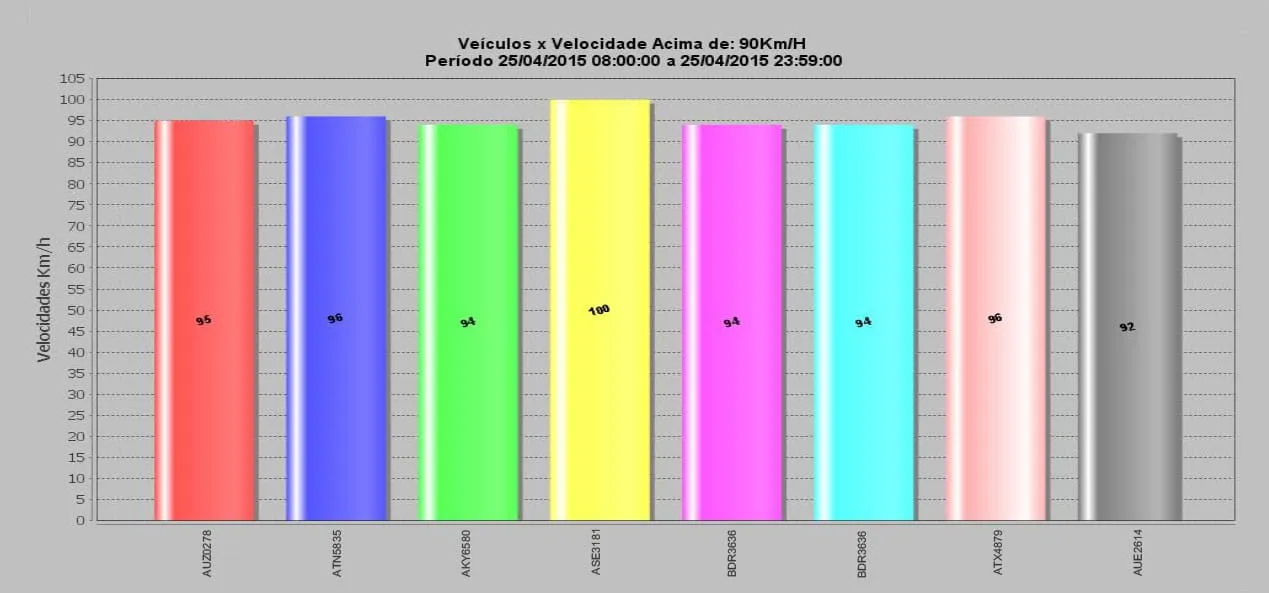
Estou implementando num projeto a funcionalidade de criação de gráficos com a biblioteca JFreechart, até aí tudo bem, já estou gerando o gráfico porém, me deparei com o seguinte problema, como faço para não mostrar a legenda e adicionar a placa abaixo de cada barra como a imagem anexada a este tópico.
Minha classe esta assim:
BufferedImage buf2 = null;
		try {
			DefaultCategoryDataset ds1 = new DefaultCategoryDataset();
			List<TsVeiculoPos> listaVeiculos = (List<TsVeiculoPos>) JsfHelper.getSessionAttribute("listaVeiculoPosFr");
			TsVeiculoPos veiculo = new TsVeiculoPos();
			Integer velocidade = (Integer) JsfHelper.getSessionAttribute("velocidade");
			String data1 = (String) JsfHelper.getSessionAttribute("data1");
			String data2 = (String) JsfHelper.getSessionAttribute("data2");
			for (int i = 0; i < listaVeiculos.size(); i++) {
				veiculo = listaVeiculos.get(i);
				ds1.setValue(Double.parseDouble(veiculo.getVelocidade()), veiculo.getVeiculo().getPlaca(), "");

			}
			JFreeChart chart2 = ChartFactory.createBarChart(
					"Veículos x Velocidade Acima de: "+velocidade+"Km/H \nPeríodo " +data1+ " a " +data2, "Placas", "Velocidades Km/h",
					ds1, PlotOrientation.VERTICAL, true, true, true);
			chart2.setBackgroundPaint(Color.lightGray);
			chart2.getTitle().setPaint(Color.black);
			java.awt.Font tit = new java.awt.Font("ARIAL", 1, 15);
			tit.isBold();
			chart2.getTitle().setFont(tit);

			CategoryPlot p = chart2.getCategoryPlot();
			p.setRangeGridlinePaint(Color.black);
			p.setDomainAxisLocation(AxisLocation.BOTTOM_OR_LEFT);
			p.setRangeAxisLocation(AxisLocation.TOP_OR_LEFT);

			CategoryItemRenderer renderer = p.getRenderer();
			renderer.setBaseItemLabelGenerator(new StandardCategoryItemLabelGenerator());
			renderer.setBaseItemLabelsVisible(true);
			renderer.setBasePositiveItemLabelPosition(new ItemLabelPosition(ItemLabelAnchor.CENTER,
	                TextAnchor.CENTER, TextAnchor.CENTER, -Math.PI / 10.0));
			renderer.setBaseItemLabelPaint(Color.BLACK);
			java.awt.Font fonte = new java.awt.Font("ARIAL", 1, 11);
			renderer.setBaseItemLabelFont(fonte);
			renderer.setSeriesItemLabelsVisible(0, Boolean.TRUE);
			chart2.getCategoryPlot().setRenderer(renderer);


			buf2 = chart2.createBufferedImage(1000, 550,
					BufferedImage.TYPE_INT_RGB, null);

			buf2.flush();
Se alguém puder ajudar, desde já agradeço.
Cordialmente
Diego Silva